Dow Jones 30
DIA tracks a price-weighted index of 30 large-cap US stocks, selected by the editors of the Wall Street Journal. ETF
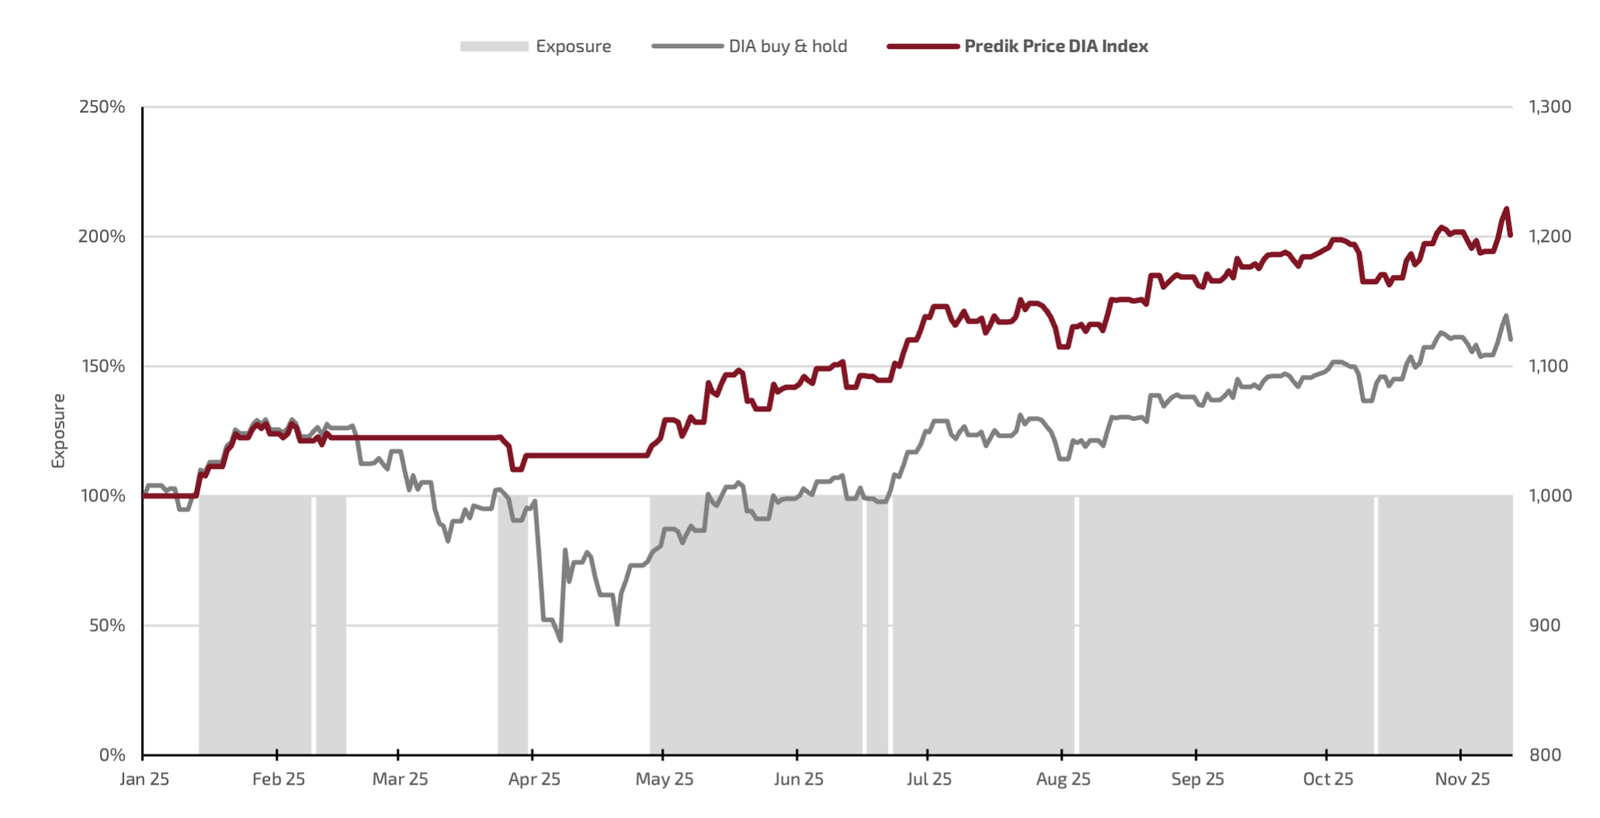
| Statistics as of 13 Nov 2025 | Predik Price DIA Index | DIA buy & hold |
|---|---|---|
| Last price | 1,200.79 | 1,120.20 |
| 26 week high | 1,221.08 | 1,139.12 |
| 26 week low | 1,020.40 | 888.34 |
| 1-month return | 3.05% | 3.05% |
| 3-month return | 4.30% | 5.63% |
| 6-month return | 11.17% | 12.63% |
| Year to date | 20.08% | 12.02% |
| Annualized return | 20.08% | 12.02% |
| Annualized volatility | 9.90% | 17.40% |
| Return over risk | 2.03 | 0.69 |
| Maximum drawdown | -3.34% | -16.12% |
| Return vs benchmark | 1.07 | |
| Total rebalancing | 15 | |
| Average rebalancing per month | 1.45 | |
| Base date | 2 Jan 2025 | |
| Last date | 13 Nov 2025 | |
| Days since launch | 315 |